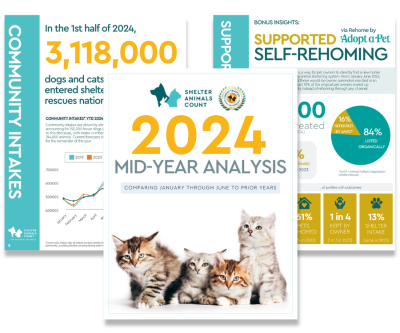
2024 Mid-Year Report
- Home
- Explore the Data
- 2024 Mid-Year Report
Dig Into Historical Data with New Dashboard
There is currently no other estimate that includes all organization types and sizes for national animal welfare data. Understanding the number of animals entering and leaving the animal welfare system allows for more and better support of organizations providing services for these animals.
These totals are estimates based on all reported data to Shelter Animals Count since January 2016. It is best used as national totals. As more data is submitted and more research is conducted on what factors impact intakes/outcomes at the organization-level, these estimates will be adjusted. The estimates are rounded to the nearest 1,000 to allow for simplicity in communication.
Data is recorded monthly and includes January 2016-June 2024.
Organizations self-identify their organization type. Shelters include organizations with a physical building location such as government animal services, shelters/rescues with a government contract and shelters without a government contract. Rescues include organizations without a physical building and that rely on fosters for operation.
Monthly data is submitted voluntarily and therefore the number of organizations reporting each month varies. To eliminate the influence of this variation, the average and median number of monthly intakes over time was reviewed, allowing us to see clear seasonal patterns and medians were determined as the best option for determining national numbers.
Monthly medians were determined for each individual organization type and species (dog and cat). Those monthly medians were then applied to the total number of shelters and rescues included in the Complete Organization List created in partnership with Adopt A Pet. This includes 4,915 shelters (government animal services, shelters/rescues with a government contract, private shelters without a government contract) and 9,515 rescues (rescues without a government contract). Rescues are more likely to be focused on either cats or dogs, so based on Adopt A Pet’s ratio of how many rescues adopt out cats and how many adopt out dogs, that number of rescue organizations was applied.
The model for national intakes is based on community intakes (e.g. strays, owner surrenders, born in care, seized, etc). Transfer numbers are not included as those would result in double-counting an animal before a “final” outcome such as adoption. Organizations identified as foster-based rescues are primary transfer partners for government funded and private organizations. We assume that animals have an initial community intake and therefore do not count their transfer as an additional intake.
Similarly, national outcomes do not include transfers out as that is not a “final” outcome for the animal.
There is currently no research that provides associations between any demographic data, human population or external data to intakes or outcomes. Many elements could impact intakes for an organization that are both within the organization’s control, such as managed or selective intake or outcome protocols, and outside of the organization’s control such as economic changes or population density. Without research to confirm how these factors impact intakes and outcomes, applying them to the model would be arbitrary.
The animal welfare industry has primarily been focused on reporting about what has happened in the past when the reality is, we can’t change the past, but we can impact the future.

