SAC's Population Balance Calculation (PBC) Helps Shelters Understand Their Pet Population Trends
- Home
- SAC’s Population Balance Calculation (PBC) Helps Shelters Understand Their Pet Population Trends
27Jul’22
Shelters across the country are full – we’ve been hearing it for months. Many are going as far to describe what they’re experiencing as a “crisis” and some are attributing it to more animals coming in through intake – and that is the case for some – but not at the level that would explain a crisis.
The data through June 2022 shows that so far in 2022 we have only seen a 2.9% increase in gross intakes compared to 2021 and we’re still 14.4% lower than 2019.
So, if it’s not intakes, what is it?
In June, Shelter Animals Count (SAC) shared that the primary driver of shelters feeling at – or over – capacity was actually the imbalance of too many animals staying behind as total outcomes fell short of intakes – for month-after-month – beginning in 2021. That, coupled with staffing and volunteer shortages, veterinarian shortage, decreased funding, and more, has made it even more challenging. (Watch presentation about it here).
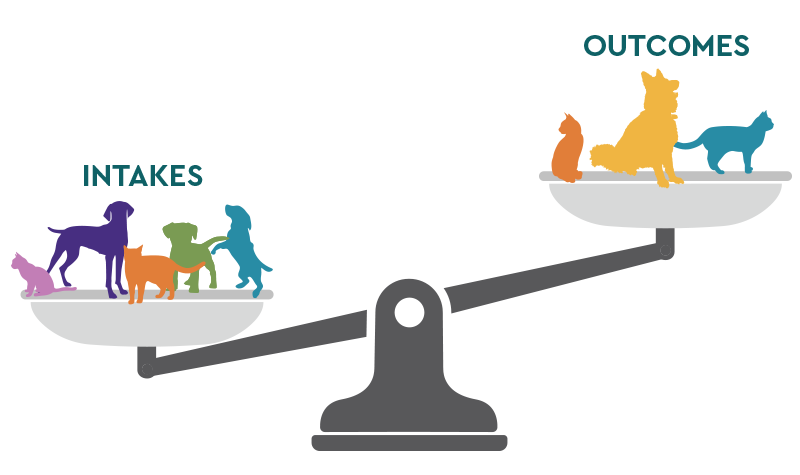
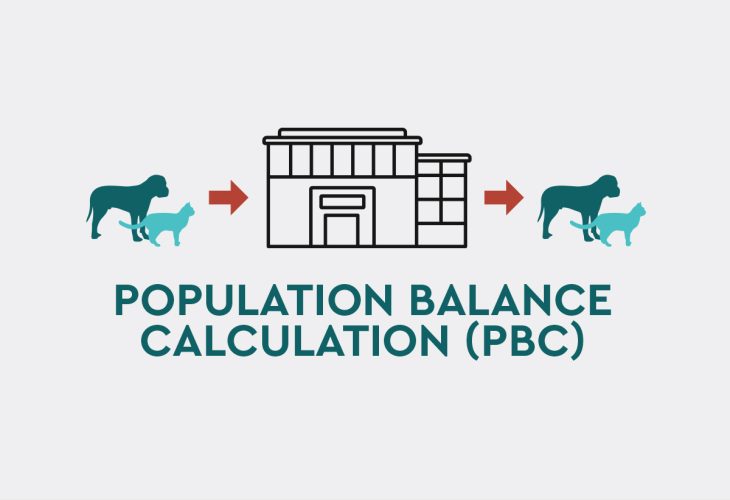
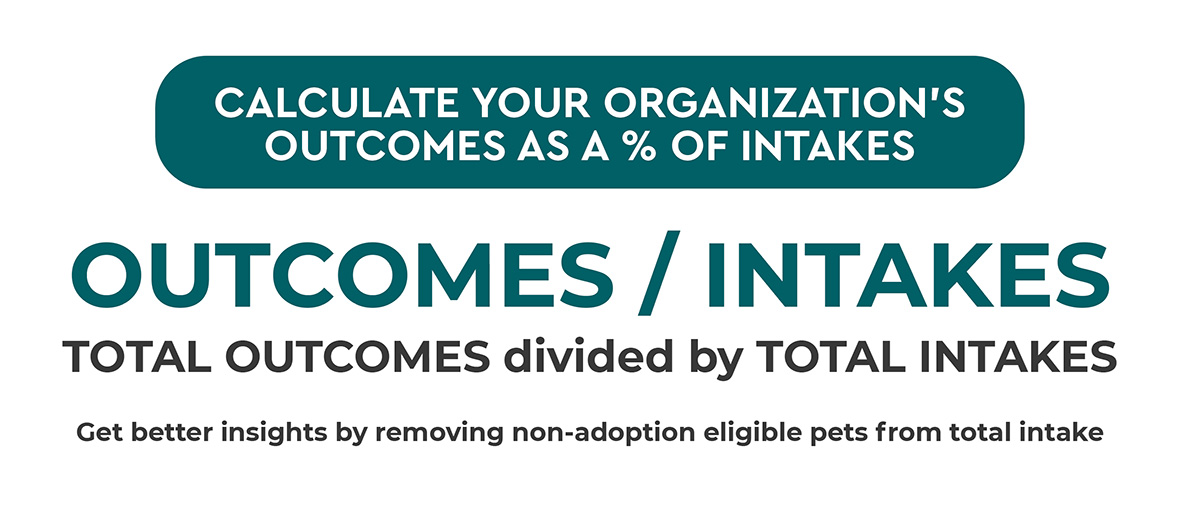
The SAC Population Balance Calculation (PBC) is the formula we use to determine if a shelter’s population is increasing, decreasing, or staying the same. It simply takes the total outcomes divided by the total intakes for a time period.
- – 100% means that animals are leaving at the exact same rate that they’re coming in so the total number of animals is unchanged (equilibrium)
- – Under 100% means the population is increasing (i.e. 97% means 3% of animals entering the shelter stayed in the shelter)
- – Over 100% means the population is decreasing (i.e. 107% mean 7% more animals left than entered the shelter)
Looking at January-June 2022, we are at a 94.2% PBC.
Simply put, so far this year there has been a national average of 6% of animals staying behind as more are added each day. (Note: The only time we were above 100% was the month of January, but that was not enough to sustain the rest of the year.)
Prairie Paws Animal Shelter in Ottawa, Kansas, Uses the PBC to Share Compelling Story About Their Population
While national averages are helpful to understand the industry as a whole, as Prairie Paws Animal Shelter shared with us, they’re using the Population Balance Calculation with their own shelter data to tell a compelling story to their stakeholders.
Executive Director, Vanessa Cowie, shared, “I have been using this calculation to communicate both to my board and my municipal partners what it means to be ‘full’ and the compounding effect of a few ‘bad months’. Prior to having this calculation I was verbally trying to get this exact point across to my stakeholders, but using this graph to show our monthly PBC really outlines our exact struggles.”
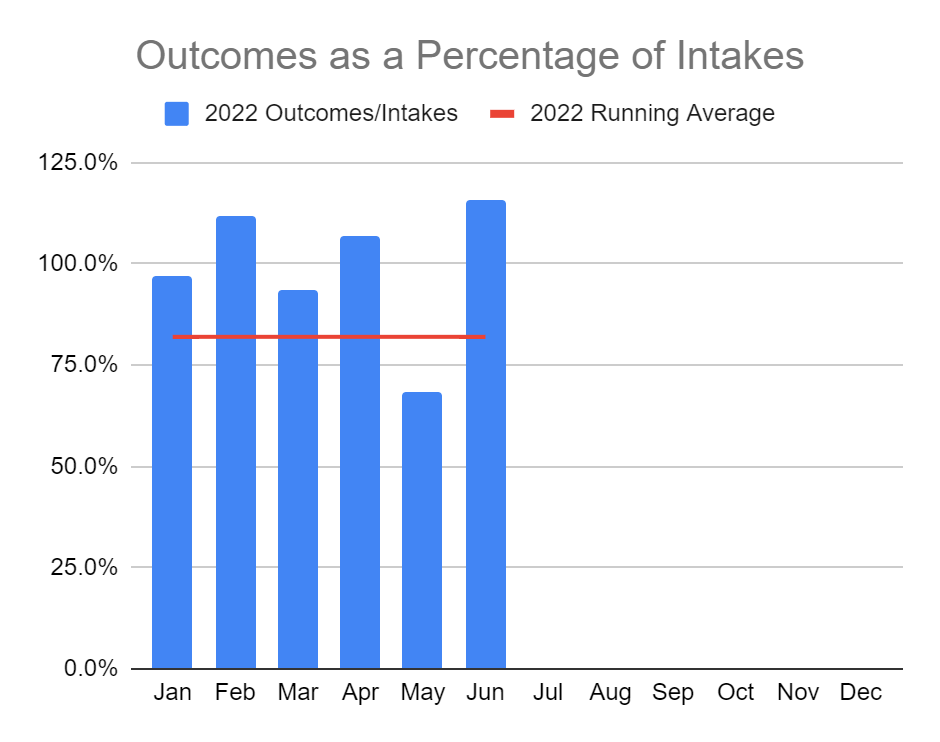
“I explain that if the blue column is at 100% then for that month we were at equilibrium (same number coming in than out), if it’s below 100% the animals we are housing is growing and if it’s above 100% then we are making up lost ground and getting closer to equilibrium. The red line is the year-to-date percentage (for us it is 82% through June). So for this year we are 18% in the wrong direction from equilibrium, but at least we know what that means so we can do something about it – and that is better than the position we were in in May,” Vanessa explained.
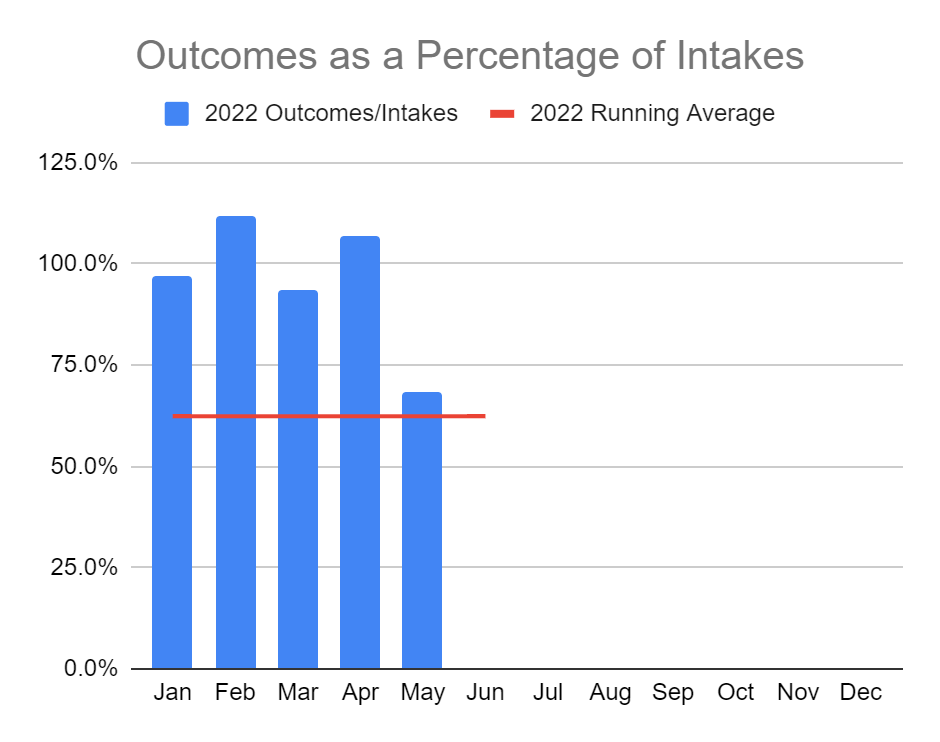
May was an exceptionally challenging month for Prairie Paws Animal Shelter, but like so many shelters across the country, it wasn’t just an increase in intakes or a reduction in adoptions. As Vanessa ran the Population Balance Calculation year-to-date through May, it began showing a clearer picture – they were at just 62.4% – meaning, more than 1/3 of the animals that had entered their shelter that year were still in the shelter. After running the PBC, Vanessa was able to use data to back up what they were feeling. “No wonder we were feeling the pain in May!”, she told us.
“My hope is that over time I can use the PBC to see seasonal trends that may be connected to kitten season, fee-waived adoption events, etc. Next, I want to run this calculation on prior years for historical comparison, and also separate out cats from dogs. I aim to use these trends to make predictions relating to resource-use, staffing, program operation, and so much more.”
****
TELL US! Are you using the Population Balance Calculation or other SAC data at your organization? We would love to hear from you! Email info@shelteranimalscount.org and tell us your story for future promotions.
Categories
Archives
- May 2025(5)
- April 2025(1)
- March 2025(1)
- February 2025(6)
- December 2024(4)
- November 2024(2)
- October 2024(4)
- September 2024(3)
- August 2024(2)
- July 2024(3)
- June 2024(4)
- May 2024(5)
- April 2024(6)
- March 2024(6)
- February 2024(16)
- January 2024(10)
- December 2023(9)
- November 2023(5)
- October 2023(1)
- September 2023(8)
- August 2023(7)
- July 2023(3)
- June 2023(4)
- May 2023(3)
- April 2023(2)
- March 2023(8)
- February 2023(7)
- January 2023(9)
- December 2022(5)
- November 2022(3)
- October 2022(3)
- September 2022(7)
- August 2022(5)
- July 2022(5)
- June 2022(3)
- May 2022(3)
- April 2022(5)
- March 2022(6)
- February 2022(2)
- January 2022(2)
- December 2021(2)
- November 2021(3)
- October 2021(6)
- September 2021(3)
- August 2021(1)
- June 2021(1)
- October 2017(1)
- December 2015(1)
