Shelter Animals Count Intake and Outcome Database (IOD) was designed to serve as a tool for basic data collection. It is a simple database containing what many (including Asilomar, ASPCA, National Federation of Humane Societies, American Humane, UC Davis, Maddie’s Fund, PetSmart Charities, HSUS, and Shelter Animals Count) have agreed are the minimum data points (along with definitions) an organization should gather.
Whether organizations already gather a great deal of data or have only gathered the basics, this database provides a common framework. This database does not reflect any preference in data analysis or the calculation of rates but is rather simply a tool for data collection.
The Intake and Outcome Database only tracks services provided to animals counted as an intake/outcome.
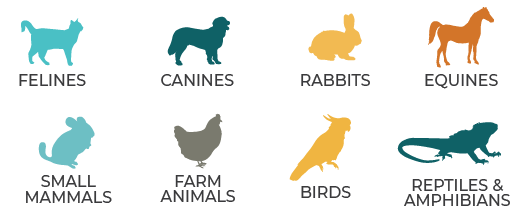
What species are tracked in the Intake and Outcome Database?
Equine: Horses, donkeys, mules, and other equines
Small Mammals: small domestic mammals such as guinea pigs, hamsters, rats
Farm Animals: Non-equine, hooved farm animals like pigs, llamas, and cows
Birds: Domestic birds like chickens, pigeons and parrots
Reptiles and Amphibians: Pet reptiles and amphibians like turtles, snakes, iguanas
Click on the Buttons Below to View Each Dashboard of the Intake and Outcome Database
All of the dashboards below illustrate actual data submitted by organizations in the U.S. and Canada. While we work to achieve 100% reporting organizations, these dashboards represent a sample of organizations across each country.
View monthly data in a single year. This data can be filtered to full or partial datasets for the year selected.
This dashboard should not be used for year-over-year comparisons.
See aggregate counts for the year from organizations that have submitted all and/or some months.
This dashboard should not be used for year-over-year comparisons.
View monthly data in a single year from both U.S.- and Canadian-based organizations. This data can be filtered to full or partial datasets for the year selected. This dashboard should not be used for year-over-year comparisons. Find modeled data here.
Data Detail
See aggregate counts for the year from U.S. and Canadian organizations that have submitted all and/or some months.
This dashboard should not be used for year-over-year comparisons. Find modeled data here.